Find your way around the studio
A palette on the left, a canvas in the middle, a settings panel on the right, and a plain-English check along the bottom.
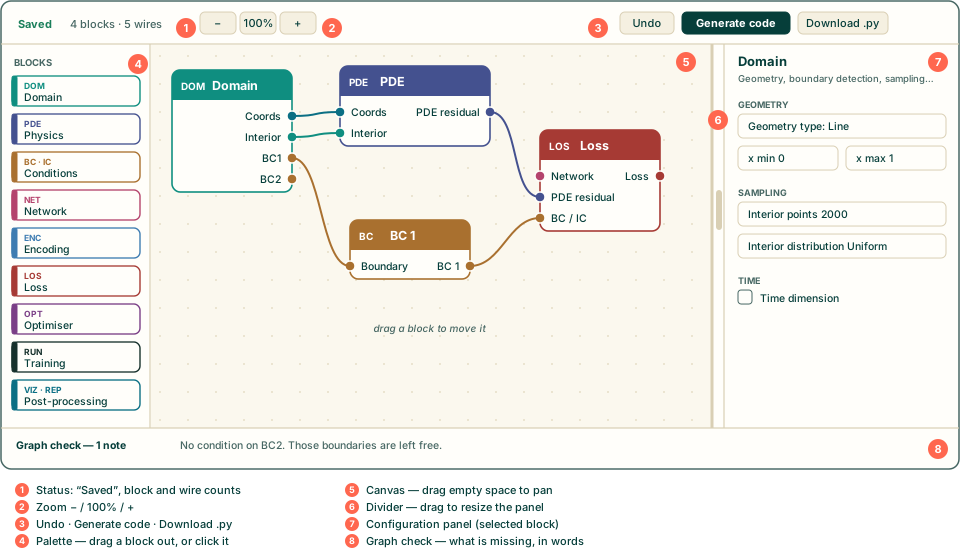
An open notebook is a single screen with four working areas. The drawing below is a schematic of the layout, with each region numbered; the list under it says what each one does.
Your screenshot · an open notebook (the Poisson on a square starter works well), full width, with the right-hand panel showing the Domain block.
1. Status and counts
At the top left the studio shows Saved and a count such as 4 blocks · 5 wires. The notebook saves itself about a second after every change, so there is no Save button. While it writes you see Saving…. If the browser refuses, the label reads Not saved — retrying and the studio tries again every few seconds. If you see that, press Download notebook (top of the page) to keep a copy.
2. Zoom
The −, 100% and + buttons zoom the canvas from 40% to 180%. Zooming keeps whatever is at the centre of the view where it is. The middle button resets to 100%. Zoom out when a big notebook stops fitting; zoom in to place a wire accurately.
3. Undo, Generate code, Download .py
Undo steps back through your recent edits: placing a block, removing a block, adding a wire, removing or replacing a wire. Press Ctrl+Z (⌘+Z on a Mac). Ctrl+Y or Ctrl+Shift+Z redoes it. The studio remembers the last 60 steps of the current session. Two things are not on that list: moving a block, and typing into a settings field. Neither can be undone, so retype the old value if you change your mind. Ctrl+S saves immediately instead of waiting for the automatic save.
Generate code builds the script and shows it in a window with Copy code, Download .py and Close buttons. Download .py skips the window and saves the file directly. Both are covered in Check the graph and generate the code.
At the very top of the page, in the bar with the breadcrumb, Download notebook saves the notebook itself (the blocks, wires and settings) as a .json file, and Delete notebook removes it from this browser after a confirmation.
4. The palette
The Blocks list on the left is grouped by family: Domain, Physics, Conditions, Network, Encoding, Loss, Optimiser, Training, Post-processing. Each family has its own colour, and the blocks you place wear it. Hover over a block to see what it is for. Drag it onto the canvas, or click it and it appears near the top left of the visible canvas. You can also tab to a block in the palette and press Enter.
5. The canvas
The big middle area is where blocks and wires live. It scrolls. To move around, drag any empty part of it (the cursor becomes a hand). Clicking empty space deselects the selected block. Working on the canvas covers placing, moving and removing blocks.
6. The divider
The thin vertical bar between the canvas and the panel is a handle. Drag it to make the settings panel wider or narrower, between 240 and 560 pixels, or focus it with the keyboard and use ← and →. The width is remembered in this browser. A wide panel is useful for the Loss block, which can list many weights.
7. The configuration panel
Click a block and its settings appear on the right, grouped under small headings. With nothing selected the panel says Nothing selected and reminds you to start with the Domain, because everything else takes its coordinates from there. Fields, help icons and formulas are covered in Read and change a block's settings.
8. Graph check
The strip along the bottom is a running commentary in plain English on what is missing or inconsistent. It says Graph check: nothing to flag. when all is well, or Graph check — 3 notes followed by the notes. It updates as you save, usually a moment after each change.
Right after you open a notebook it may say Graph check: waiting for the Lab engine to load…. That is the Python environment starting up; the notes appear when it is ready. A note is advice, not an error: the Lab will still generate a script, using sensible defaults for whatever is missing. The page When the Graph check complains lists every message and what to do about it.
Try it
Open a starter and, without changing anything, do these five things: zoom to 60% and back to 100%; drag the divider; click each block in turn and watch the panel change; drag empty space to pan; delete a wire by clicking it and then press Ctrl+Z. That is the whole interface.